Trading Tick
Trading Tick for tick by tick trading of call vs put oi charts for option analysis for tick trader on historical data
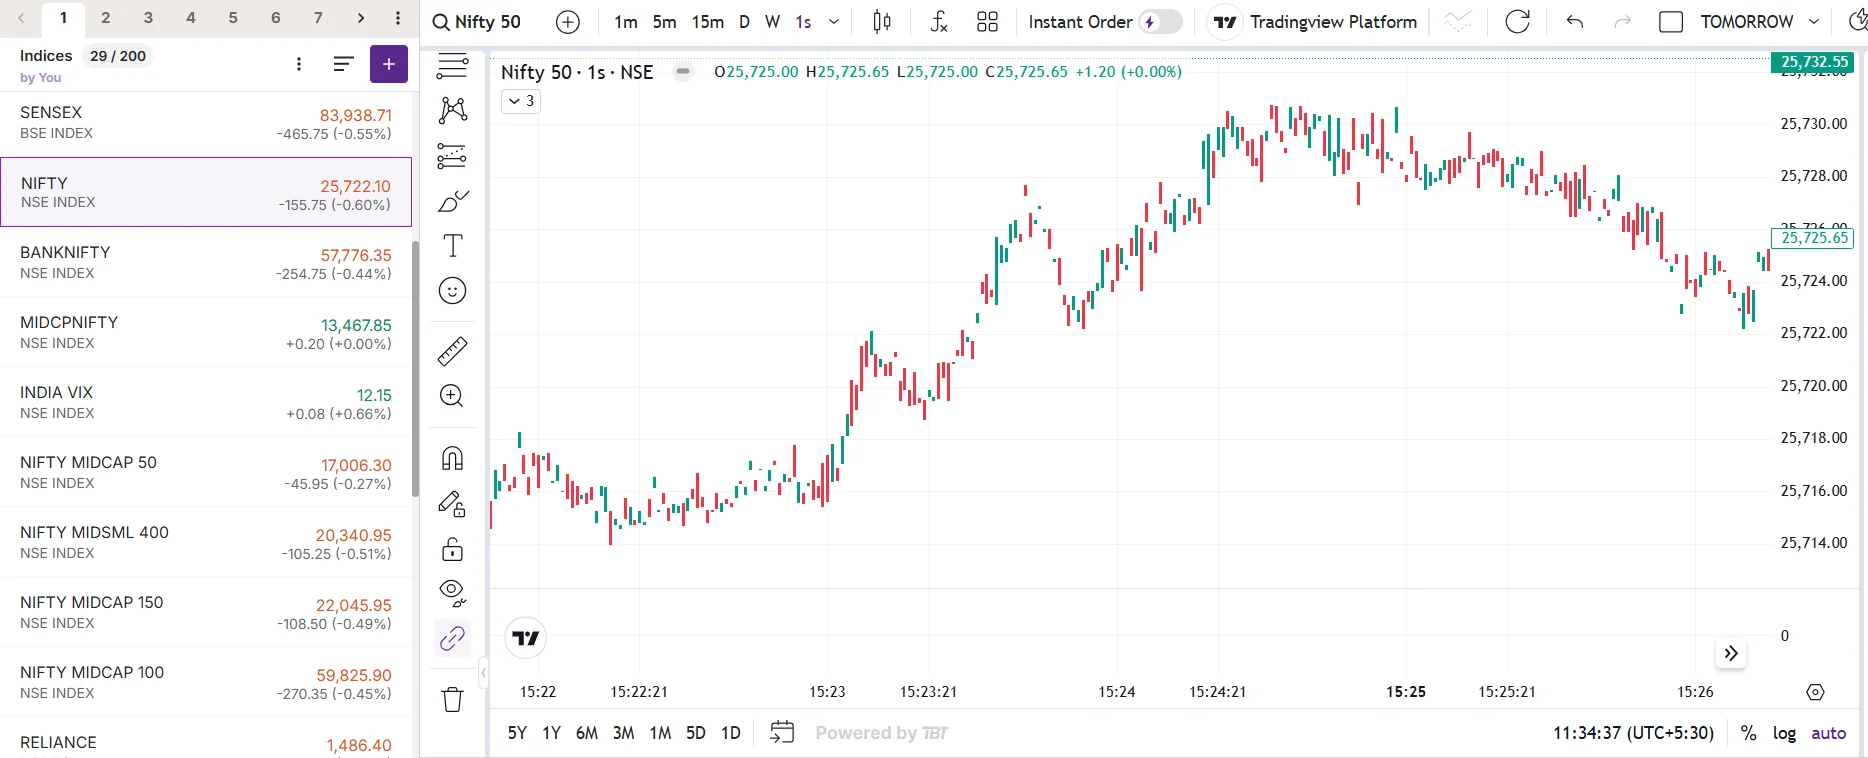
Nifty Live
Backtesting
Sponsored Ads
"ALL YOU NEED IS ONE STRATEGY TO MAKE A LIVING"
Tick by Tick Chart vs Minute chart

Trading Tick
A trading tick is the price movement of a stoc, forex, index or commodity in the market. Each tick indicates the smallest change in price movement which happens, whether upward or downward. For stocks, this is typically $0.01, for some stocks it can me more like 0.05, or 0.25 or 0.50 or 1 or even 5. for futures and other options, tick sizes are different for every contract. Ticks are units of price movement that traders tracks to find out momentum, direction, volatility, and potential entry or exit points, support or reisitance in their trading strategies.
Tick by Tick Trading
Tick by tick trading is used by HFT traders or scalpers. They do track tick by prices as they want to profit from some ticks. This real-time data stream helps trades to use the tick prices in their favour, Tick by tick prices including price, volume, and timestamp for each transaction that happens in the market. It is not likke summarized data that shows information over time periods, tick by tick data gives traders complete transparency to traders into market activity, what is happening, wether the open interest is building and or unwinding, it enabling traders to do analysis of order flow, trade patterns, strike by strike oi changes and futures open interest changes
Tick Trader
A tick trader is a specialized person who making trading decisions based on very short-term price movements, like 1 seconds or milisecons, this are often HFT or Scalpers who want quick gains in multiple trades. they are often focused on individual ticks or small clusters of ticks by which they can earn quick money. These traders enter and exits trades on extremely short timeframes, they hold positions for seconds to minutes, and they mostly rely on technical analysis, on a second or a mili second time frames. Tick traders aim to profit from small, from frequent price movements rather than long-term trends or short term trades like intrada. Tick Trader require intense focus, quick decision-making, and sophisticated trading platforms. This can lead to burnout or high stress.
Tick Tick Trade
Tick tick trade are trades occurring in quick, consecutive intervals like seconds or mili seconds in financial markets. This term basically refers to high-frequency trading environments where automated systems (algo trading) execute thousands of transactions per second, with minimal time between each trade. The algo trading systems works like, machine-gun-like pace in financial stock markets which are operated electronically. Algorithmic trading systems make quick gains on tiny price movements and arbitrage systems that exist for only few seconds or minutes.
Trading Tick OI Charts
Trading tick OI charts are option analytical tools that display open interest dataon each strike price. These charts show how many option contracts are open at each strike price of nifty, bank nifty, fin nifty, sensex, stock, bank. You can get insights into market depth and liquidity of each stock or index option for each strike. By tracking Call vs Put OI changes, traders can identify potential support and resistance levels to enter and exit trades, this also helps tick traders to trail stoploss or book profits. It also helps trader to gauge the strength of price movements, so that they can enter or exit trades confidently.
How Tick Traders use Tick by Tick Chart
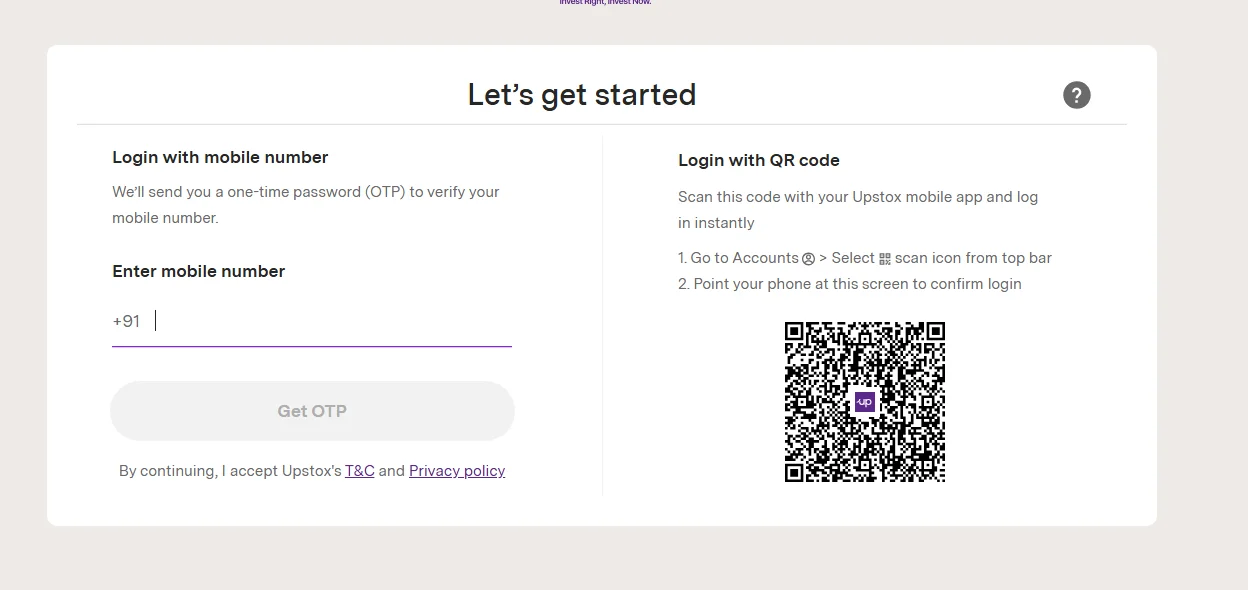
Login into your a/c
Login into brokers a/c by using your login info. We have used upstox brokers platform for demonstration purpose
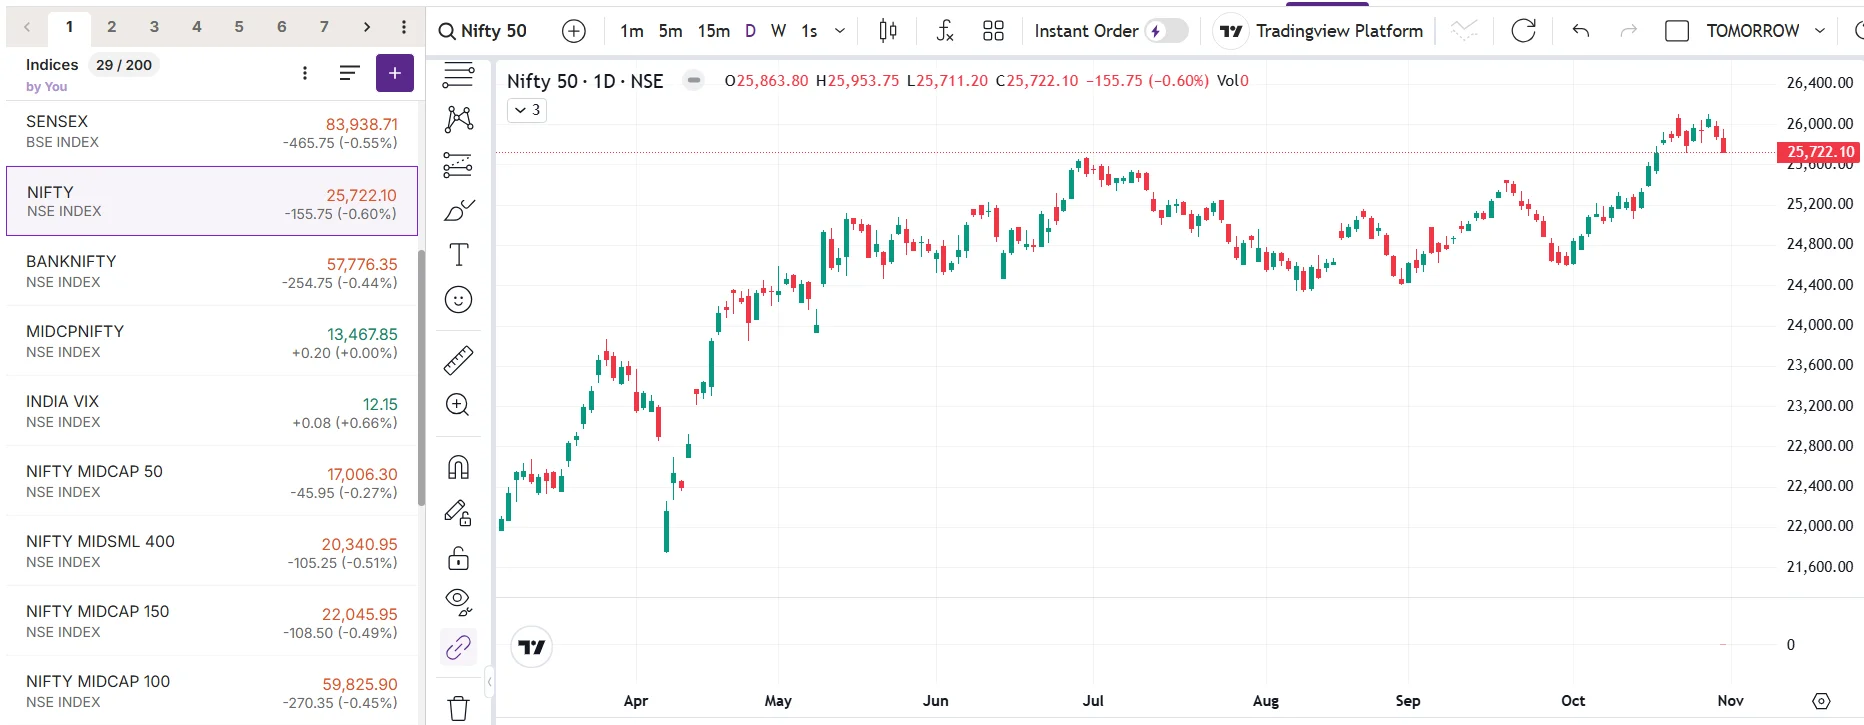
Select Stock or Index
Select Stock or Index you want to view tick by tick chart for tick trading
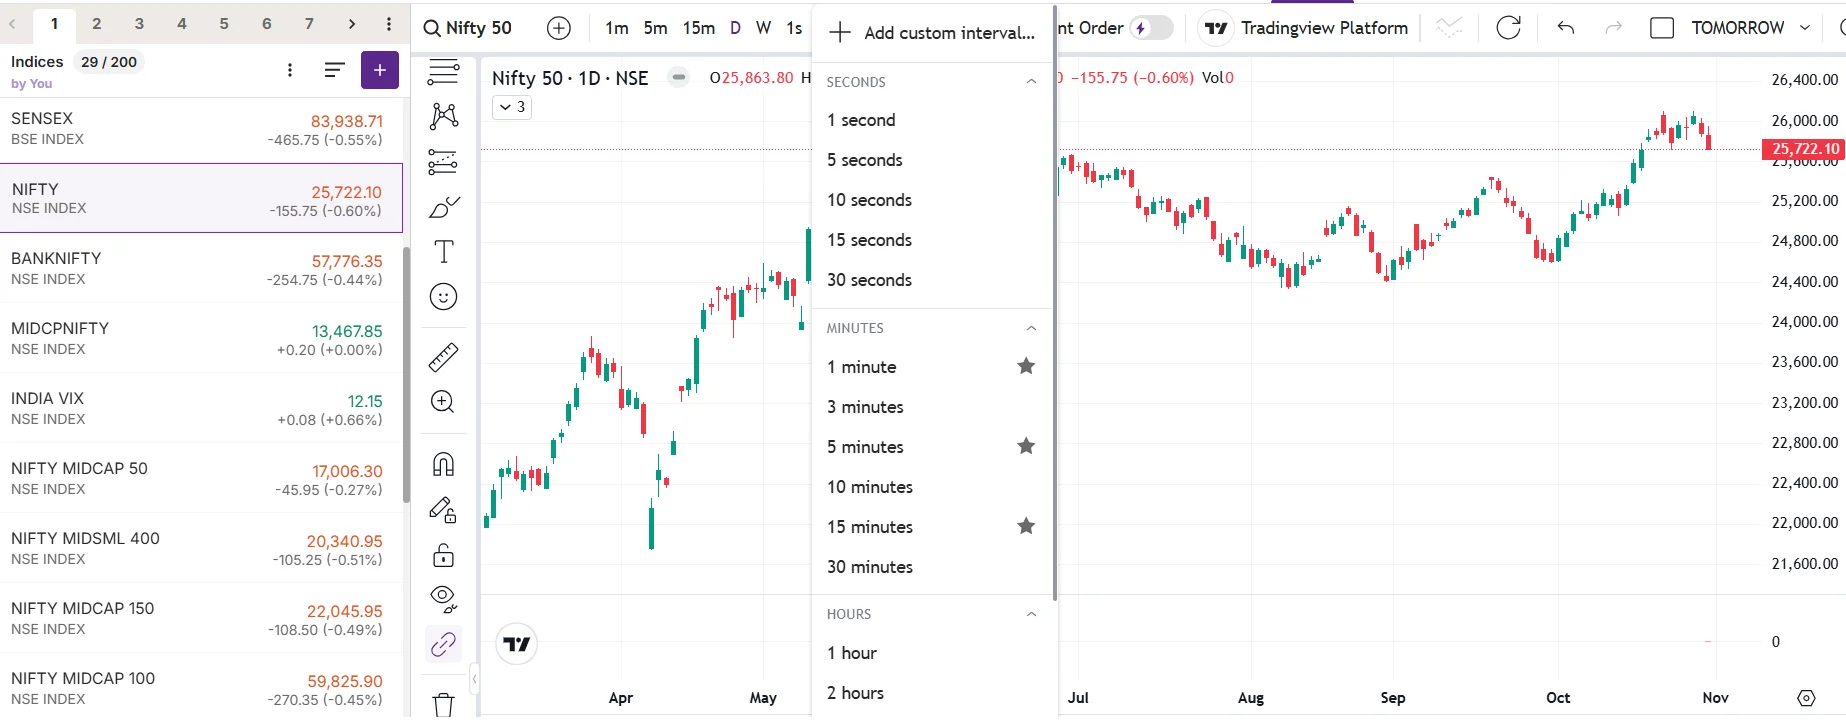
Select Tick Size
Once you have selected Stock or Index now you have to select tick size for tick by tick trading eg, 1 seconds, 5 seconds, 10 seconds, 15 seconds or 30 seconds
Tick by Tick Chart Displayed
Now your Tick by Tick Chart is ready to use for tick tick trading
Pros & Cons of Tick by Tick Trading
| Tick by Tick Trading Analysis | |
|---|---|
| Pros | Cons |
| 1. Instant Gains | 1. Trader Can Over Trade |
| 2. Fast entry and exit points | 2. Not Possible manually every time |
| 3. Used for high-frequency trading strategies | 3. Increased transaction costs due to frequent trading |
| 4. Early in trade to maximise profits | 4. Can lead to loss if whipsaw |
| 5. Instant identification of price patterns | 5. Cant be used for long-term strategies |
| 6. Better Risk management with live data | 6. Algo subscription costs reduce profits |
| 7. Better indepth analysis | 7. It requires constant screen monitoring |
| 8. Good Opportunity for arbitrage and scalping | 8. Psychological stress and burnout risk are high |
Faq on Trading Tick
We provide free historical data for future and option trading.
A trading tick is the upward or downward movement of the price of a stock or index or commodity or forex, with each tick measures the change in price from one trade to the next in different time frames.
Tick by tick trading is the trade happened on any index, stock. forex or commodity, each and every single transaction that happens in the market, it allows traders to see and check the trades as they happen in real-time or historical.
A tick trader (basically a hft trader or a scalper ) is a person who uses short-term price movements (ticks) to make trading decisions, typically he holds positions for very short time periods ranging from seconds to minutes to gain on small price changes.
Tick tick trade is the refers to the trades that are happening every min, every second, or every mili second, it often describes high-frequency trading (hft) environments where transactions are happening at extremely fast speeds (we cant even imagine, in blink of an eye ) with minimal time between executions.
Trading tick OI charts display open interest data of call nd put, showing how many contracts are open at each strikes, It helps traders to analyze market depth and liquidity, support and resistance.